网络监控
网络监控显示 Firefox 发出的所有 HTTP 请求(例如,加载页面时或由于XMLHttpRequests),每个请求花费的时间以及每个请求的详细信息。
打开网络监控
有几种不同的方法可以打开网络监控
按下 Ctrl + Shift + E(Mac 上为 Cmd + Opt + E)。
在 Web 开发者工具中选择“网络”面板,可从浏览器工具子菜单访问。
单击扳手图标
 ,该图标位于主工具栏或汉堡包菜单下
  ,然后选择“网络”。
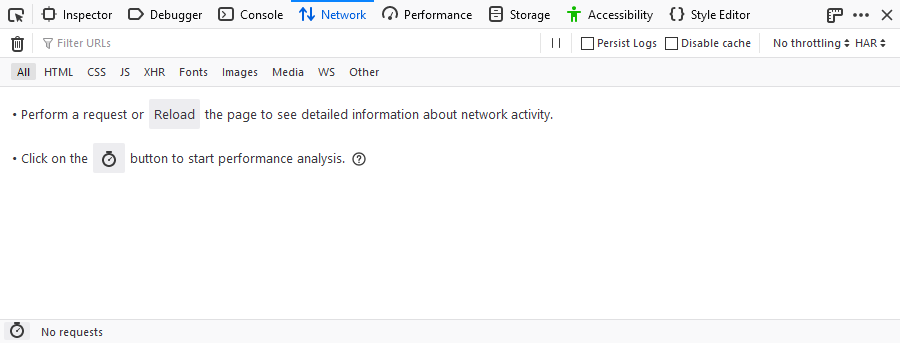
网络监控将出现在浏览器窗口底部。首次打开时,网络监控不会显示请求信息。刚刚打开的工具如下所示
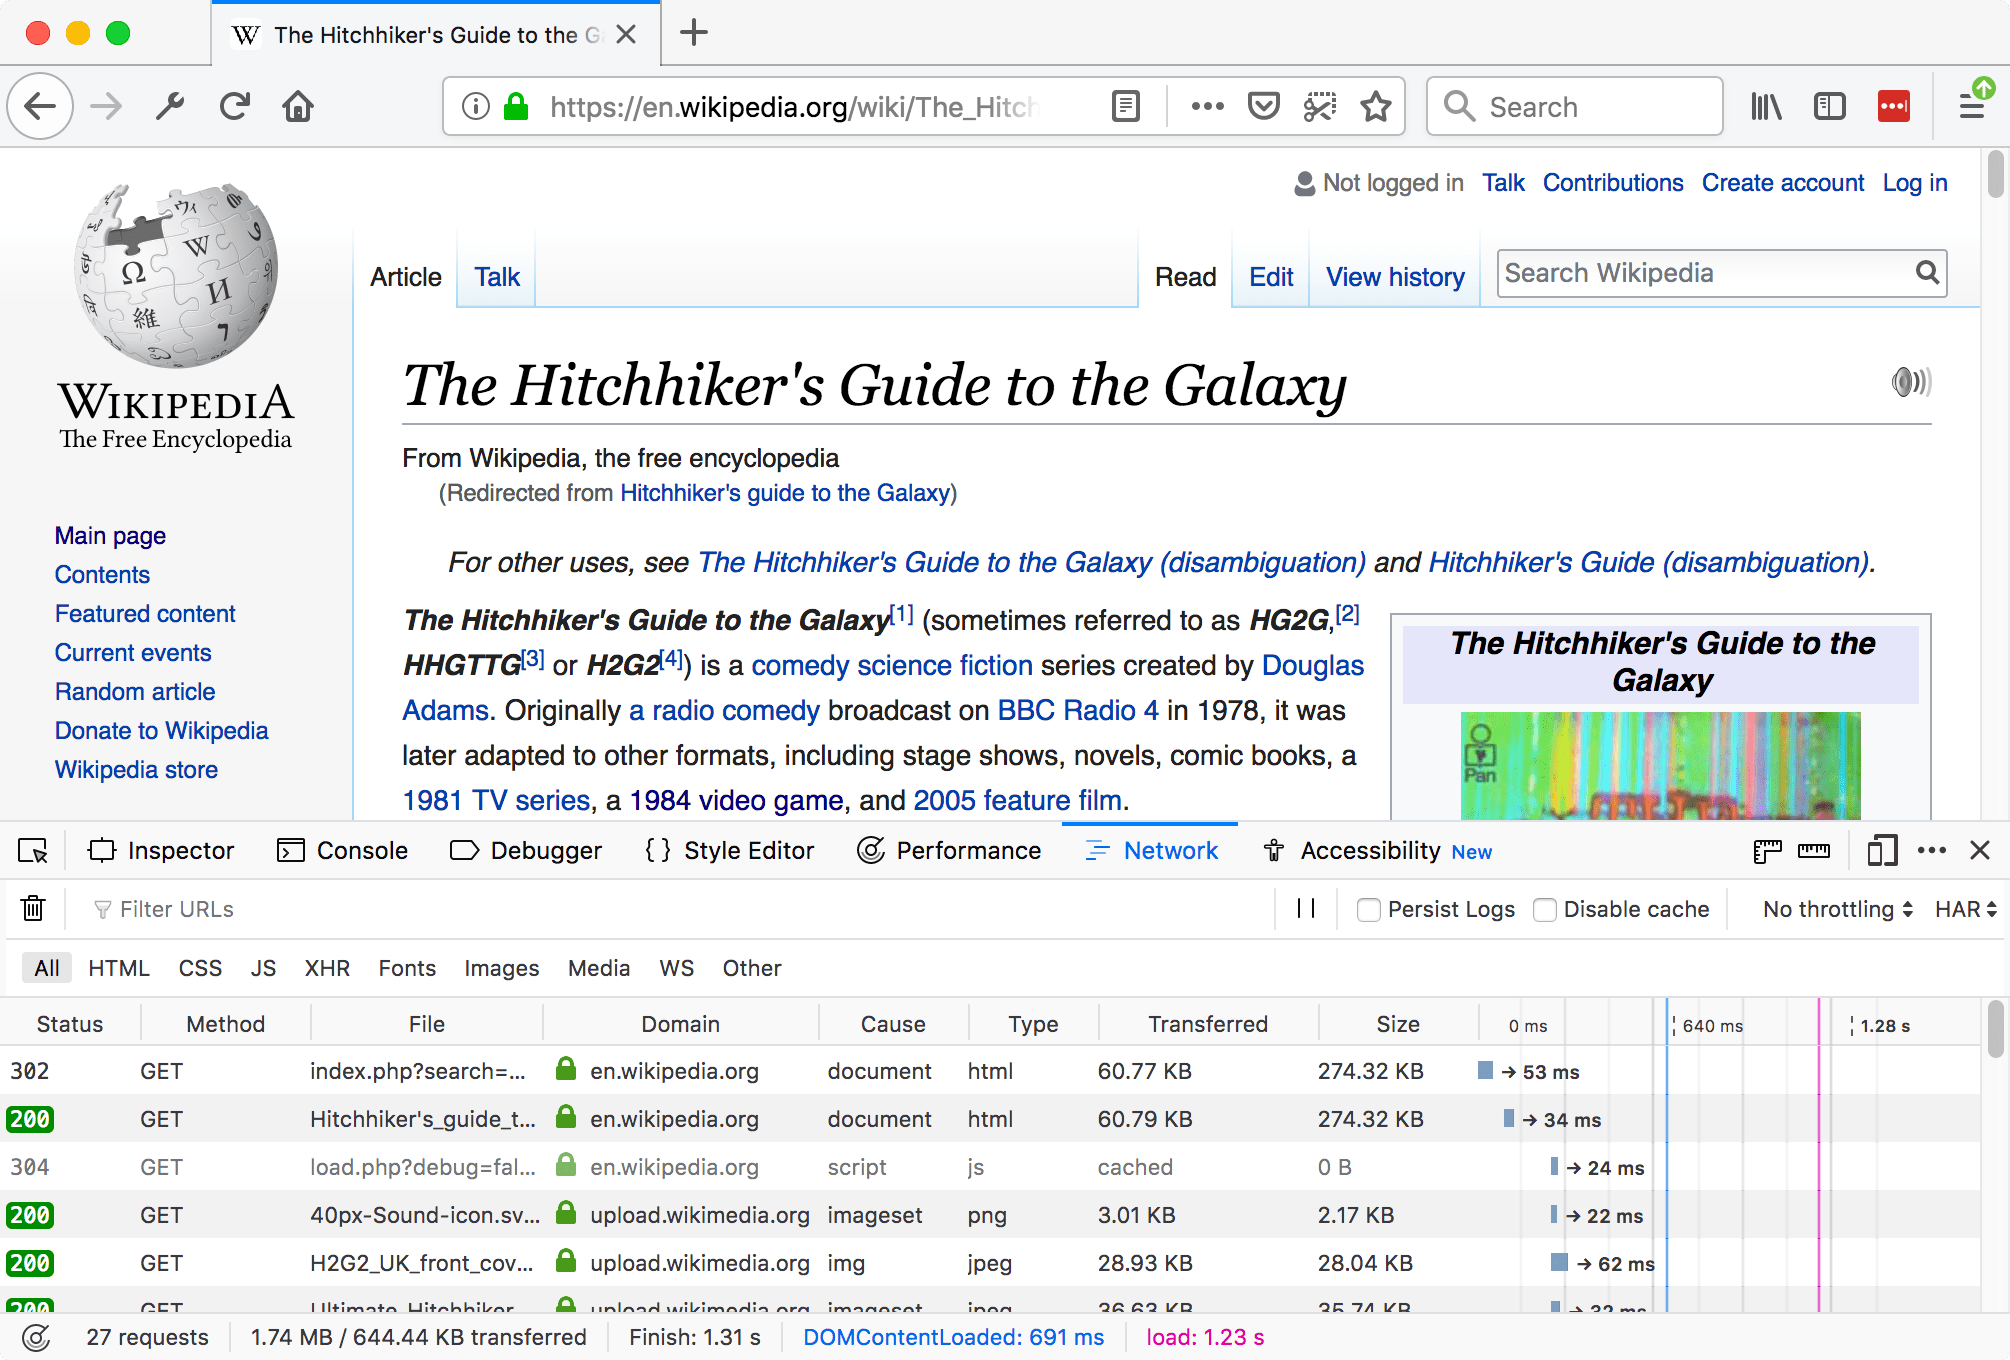
任一操作都会使网络监控开始监控网络活动。一旦工具开始监控网络请求,显示效果如下
在主动监控活动时,网络监控会在工具箱打开的任何时间记录网络请求,即使网络监控本身未被选中。这意味着您可以在例如 Web 控制台中开始调试页面,然后切换到网络监控以查看网络活动,而无需重新加载页面。
UI 概述
UI 分为四个主要部分
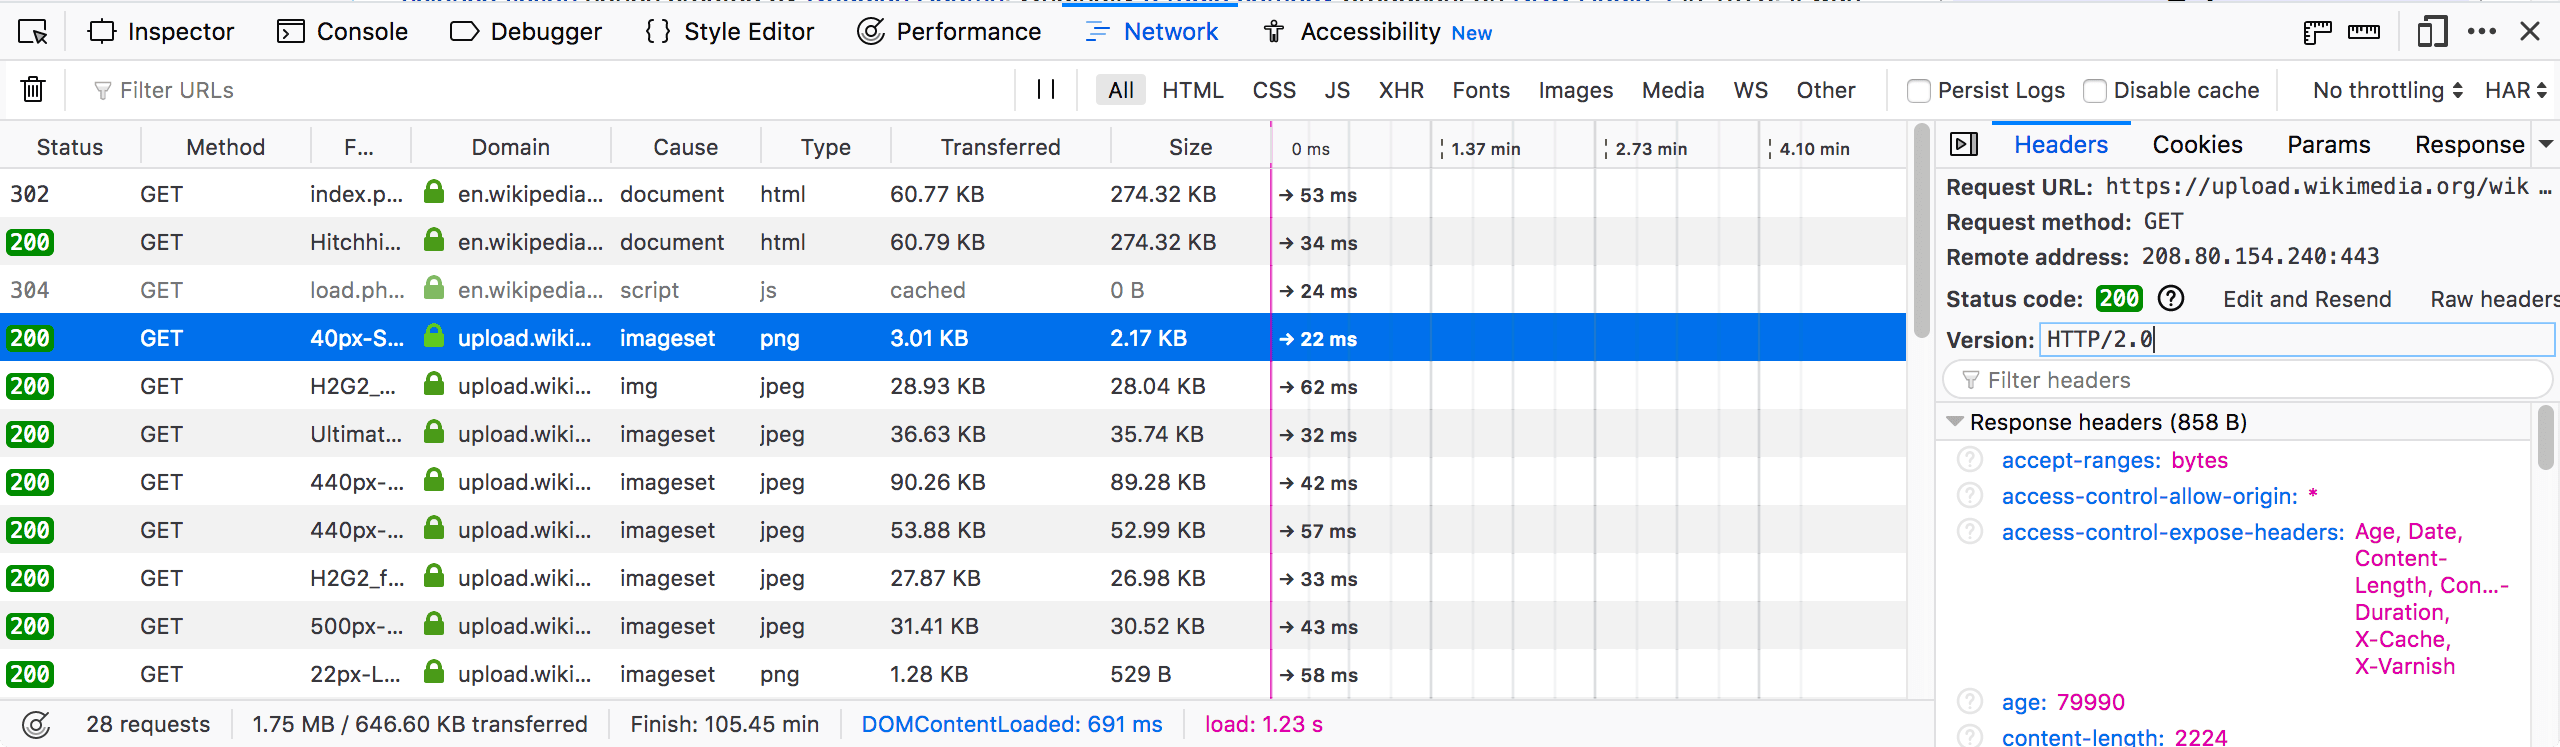
主屏幕包含 工具栏、网络请求列表 和 网络请求详细信息窗格
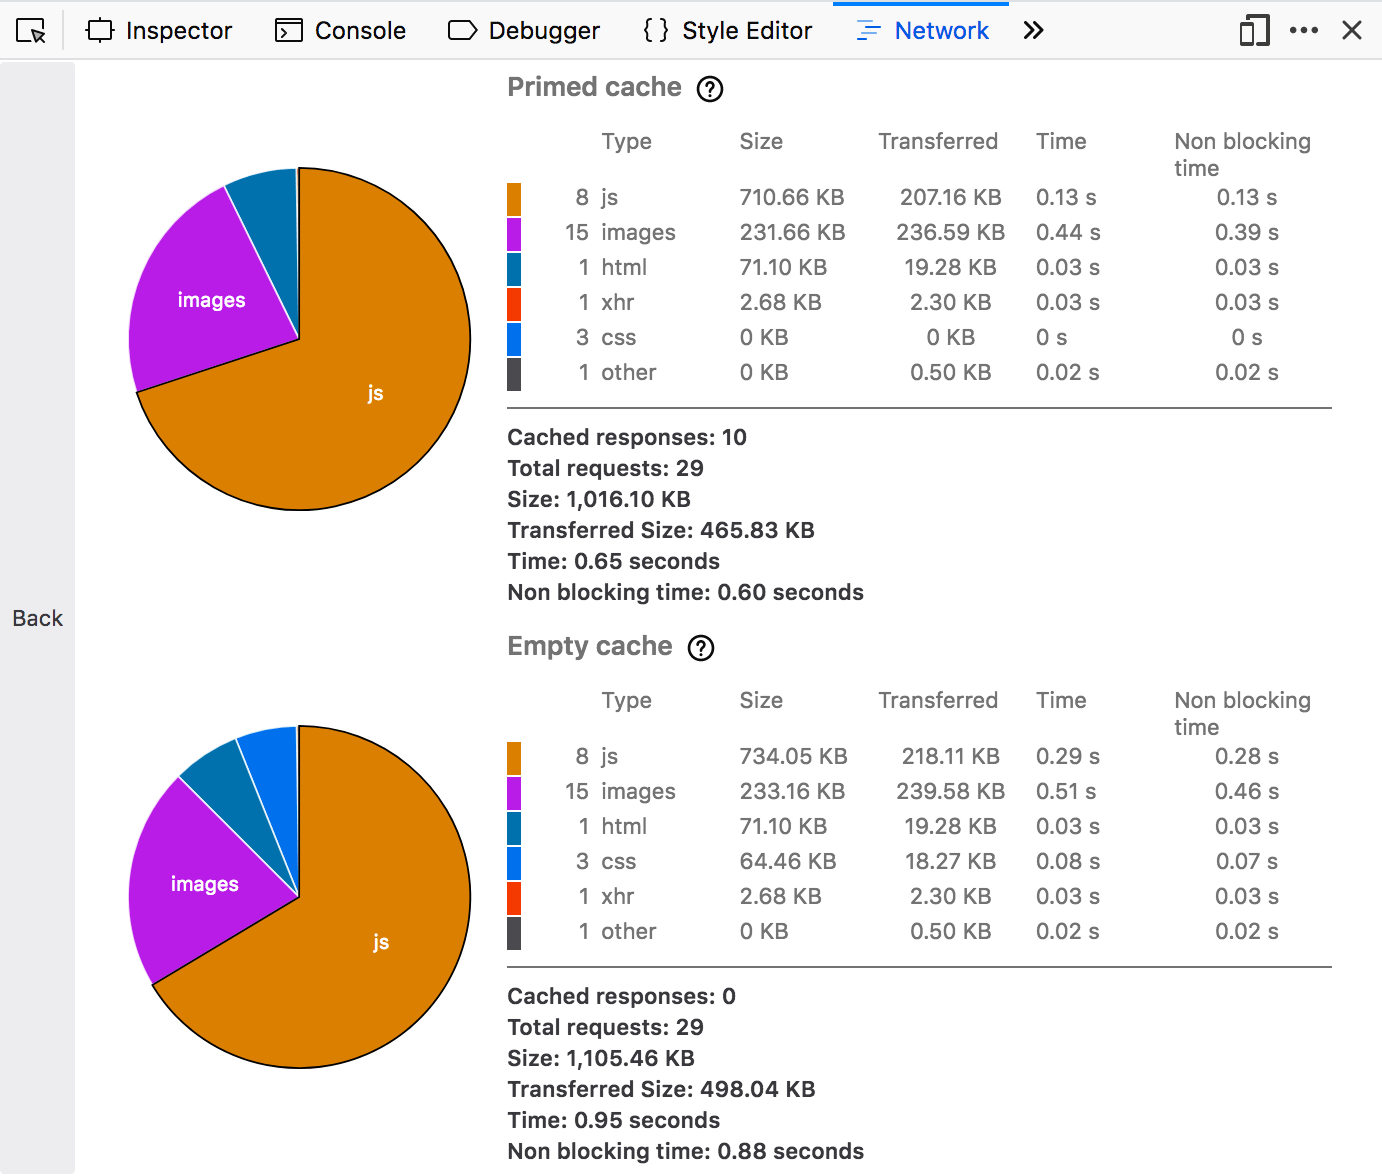
性能分析视图是单独的屏幕
使用网络监控
以下文章介绍了使用网络监控的不同方面